Both sides of interpersonal emotion regulation
How do different emotion-regulation strategies affect the feelings and neural responses of both people in an interaction?
Published 2026
- Journal
- Emotion
I contributed across the behavioral and fNIRS analyses, including preprocessing, activation analysis, interbrain synchrony and multivariate classification.
The paired task
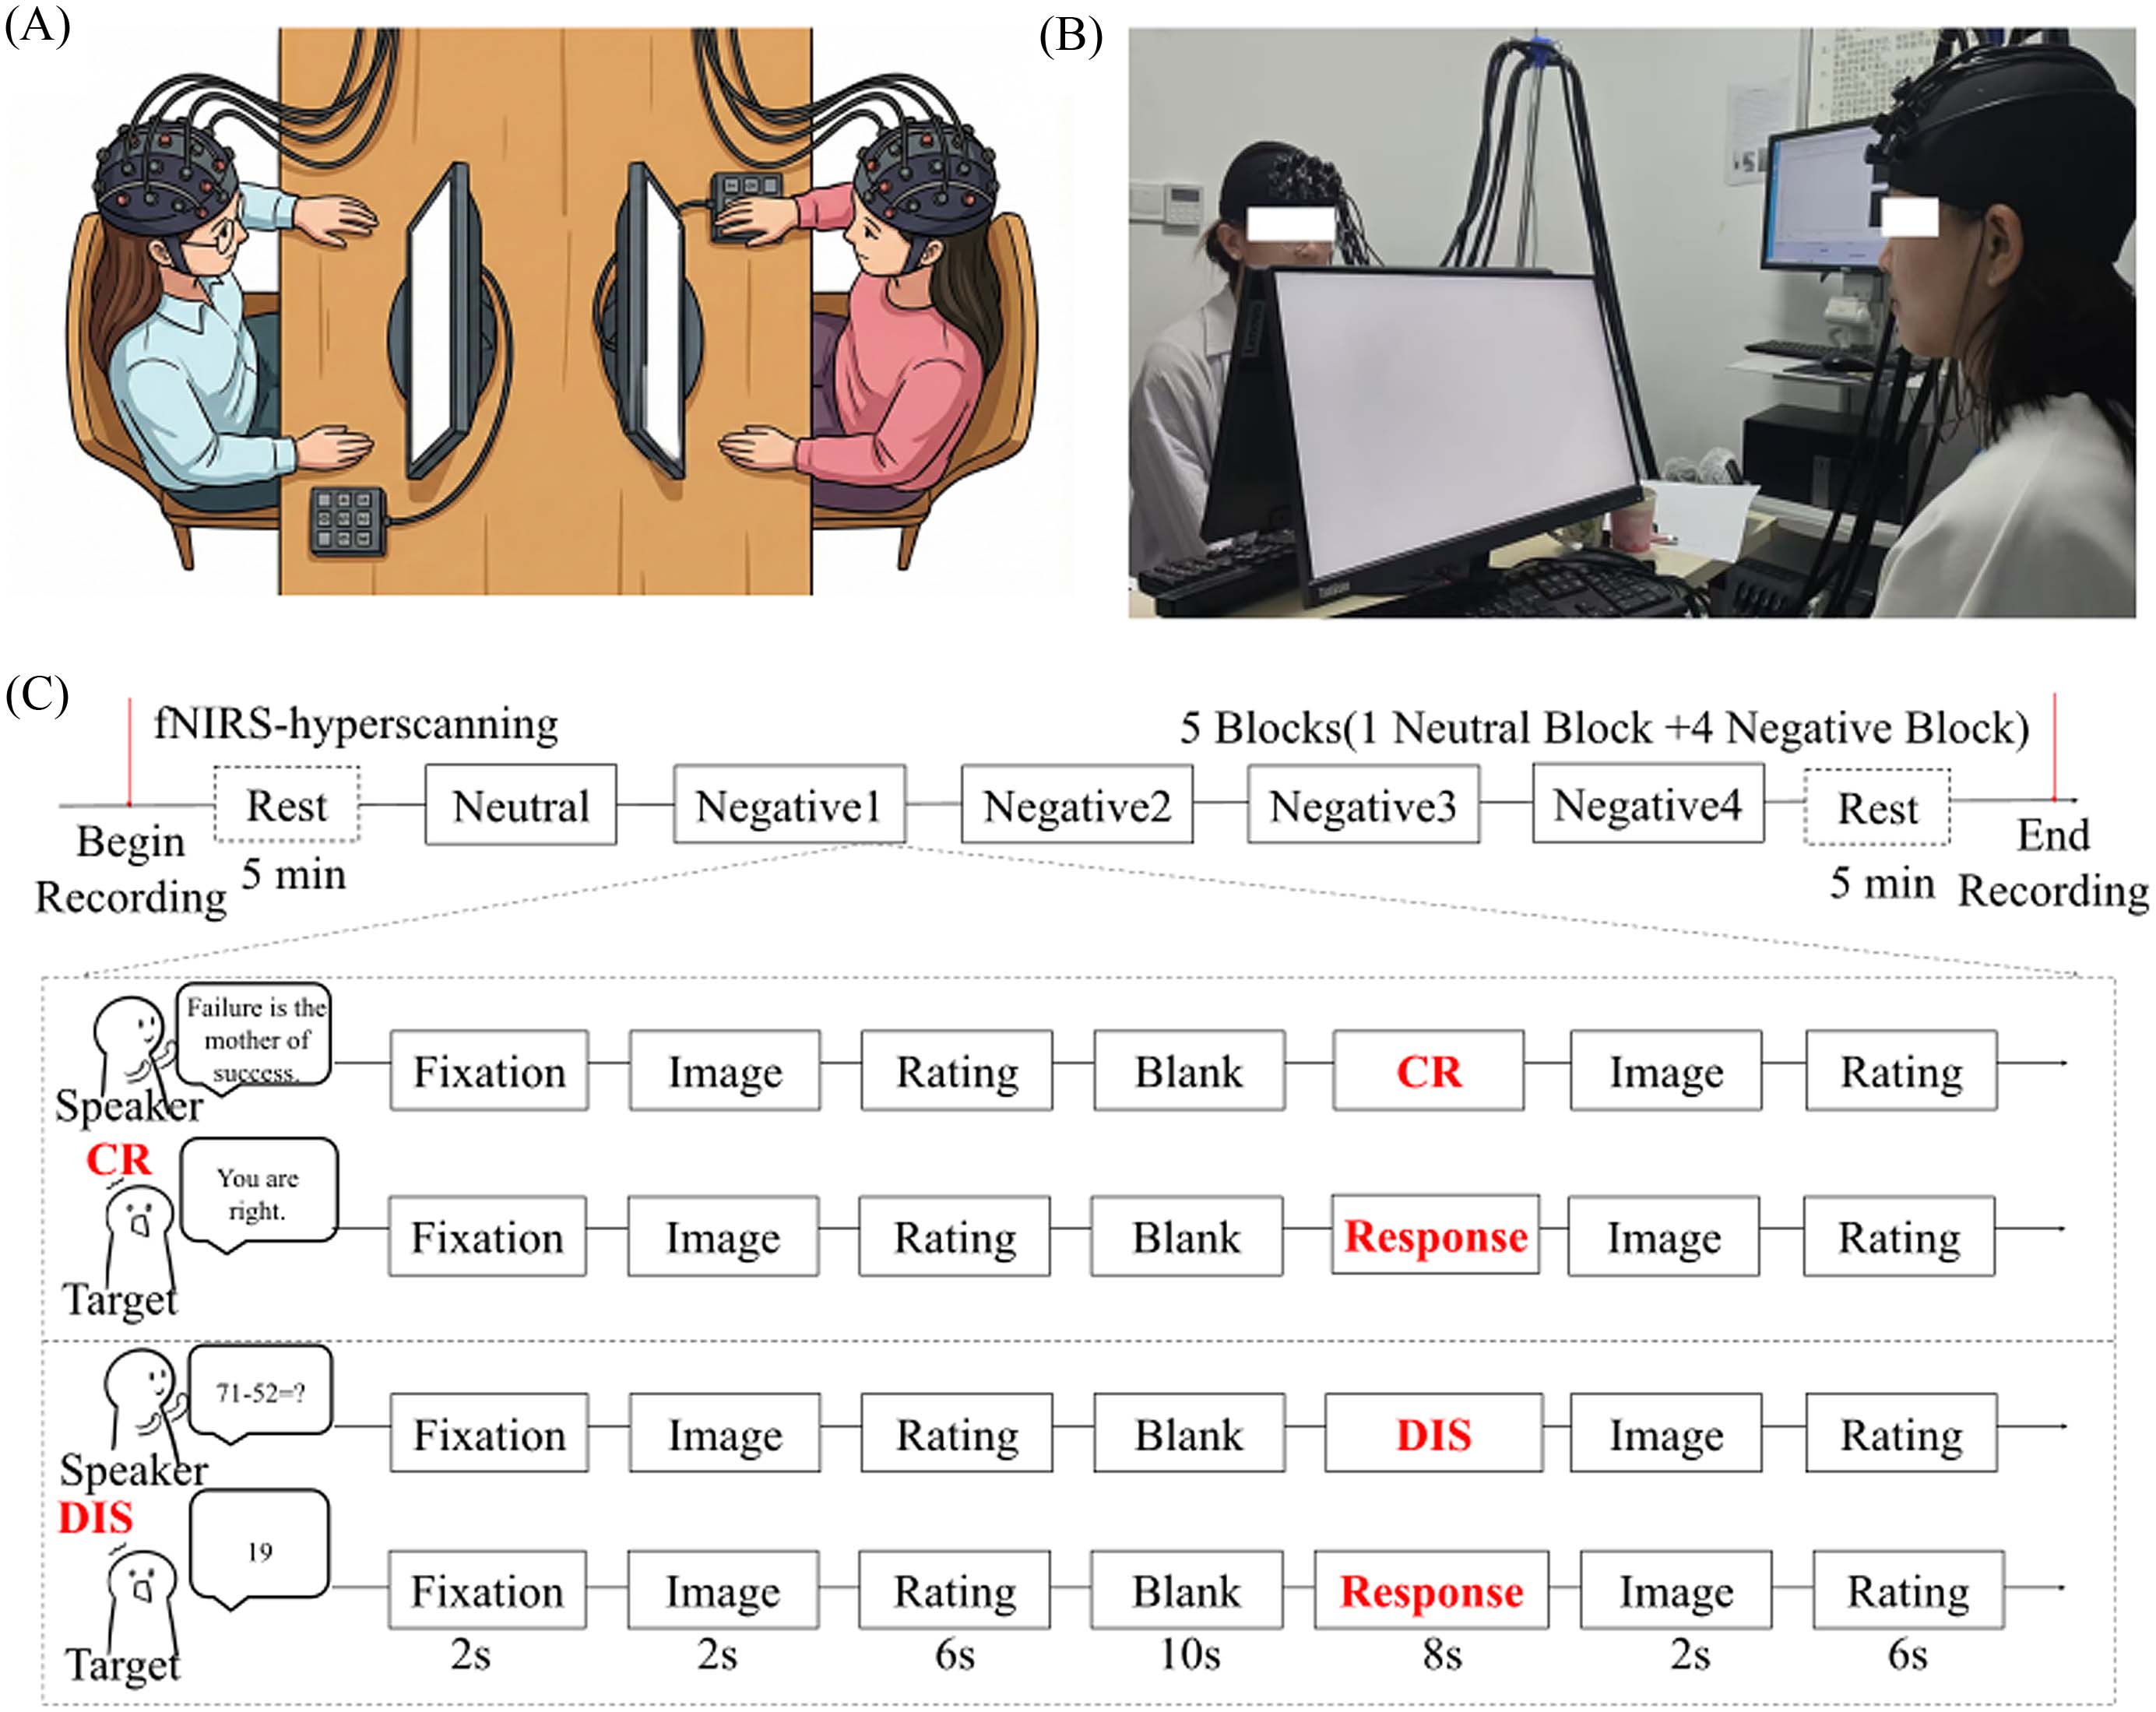 Opens in a new tab.
Where we measured
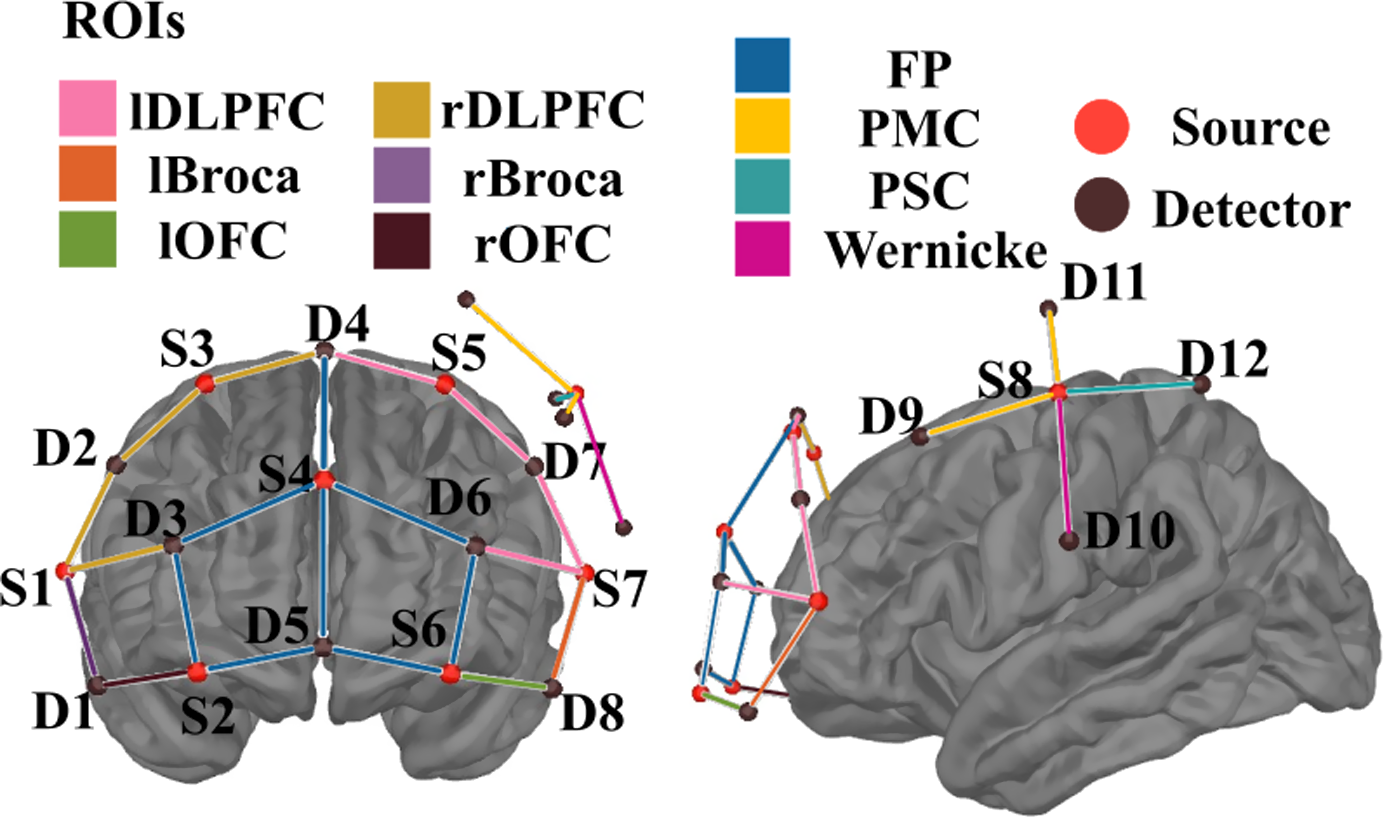 Opens in a new tab.
Valence improved, especially after reappraisal
Valence ratings were higher after regulation and higher overall for regulators than targets. Reappraisal produced higher postregulation valence than distraction; the strategies did not differ reliably before regulation. The time-by-strategy interaction was significant, while the other valence interactions and all arousal effects were nonsignificant.
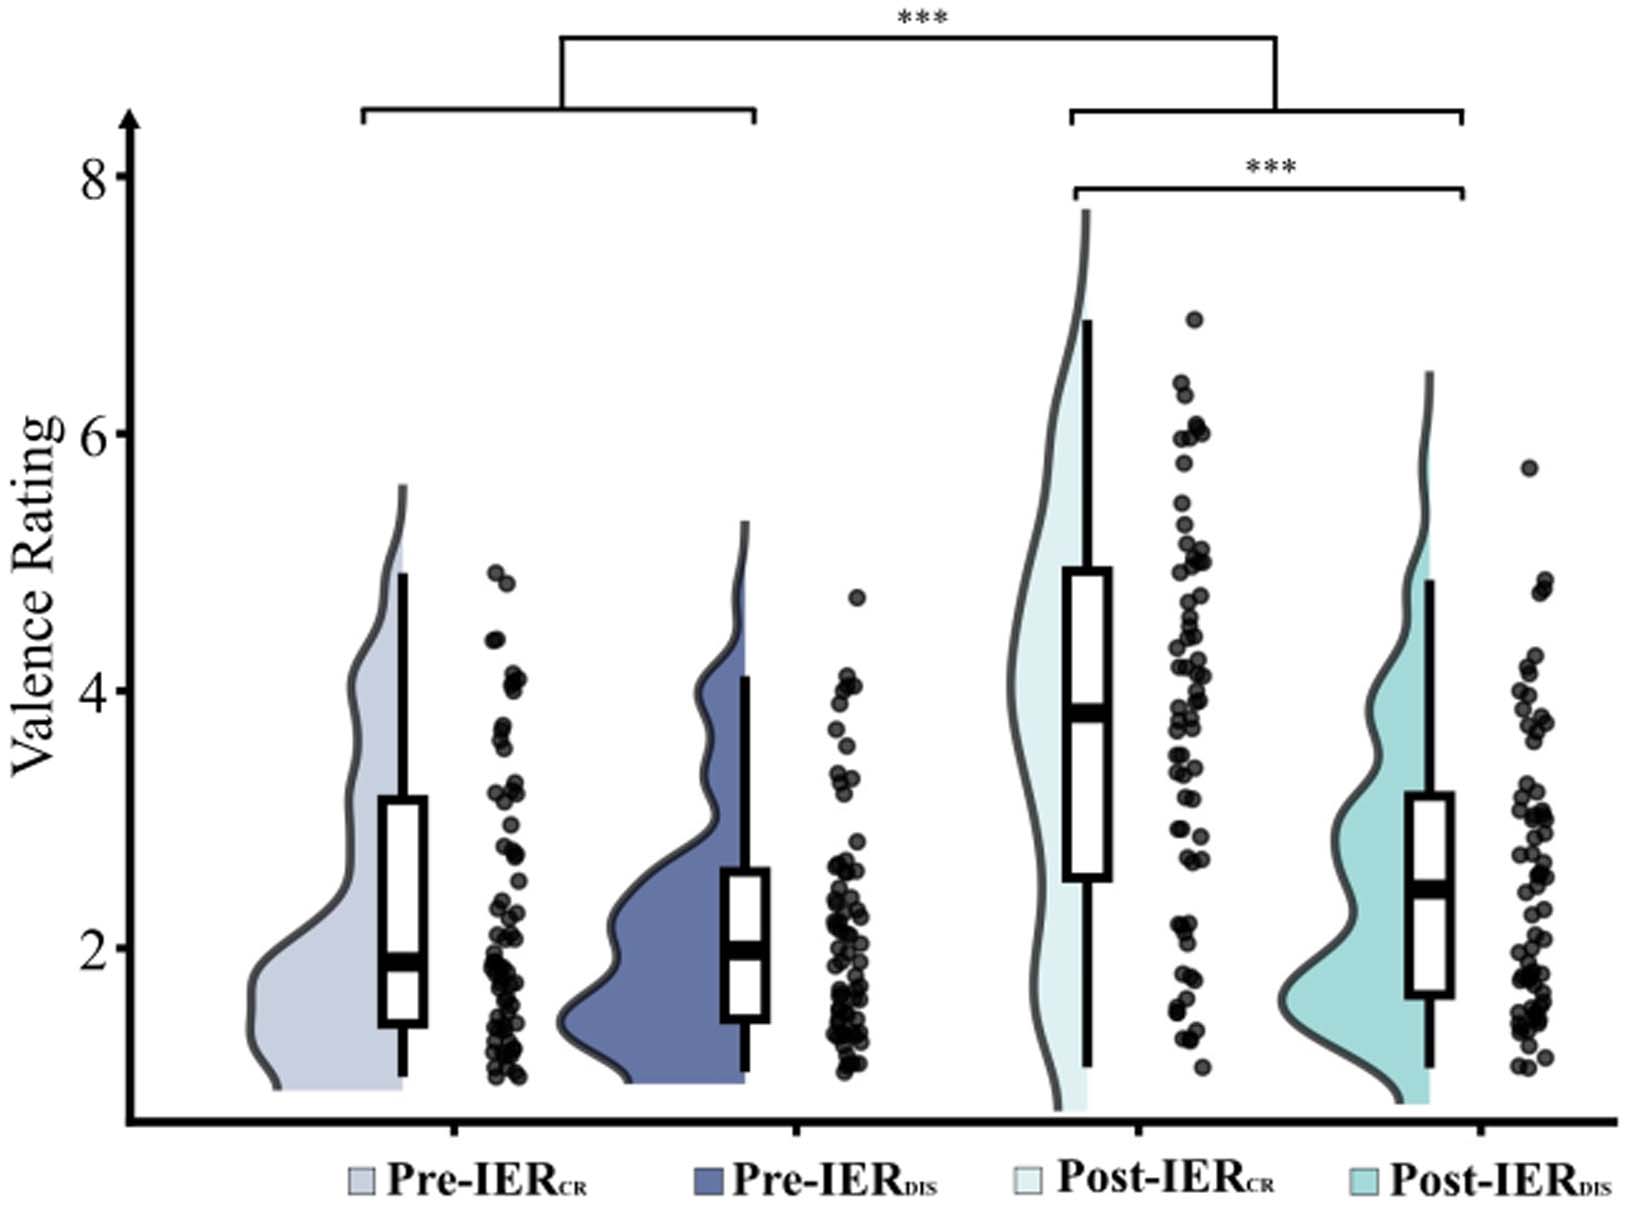 Opens in a new tab.
Activation depended on role and strategy
Role-by-strategy interactions appeared in the frontal pole (FP), left and right orbitofrontal cortex (lOFC, rOFC), and right Broca’s area (rBroca). Targets showed higher activation during distraction than reappraisal in all four regions. During reappraisal, regulators showed higher activation than targets in all four; during distraction, targets exceeded regulators in rOFC and rBroca.
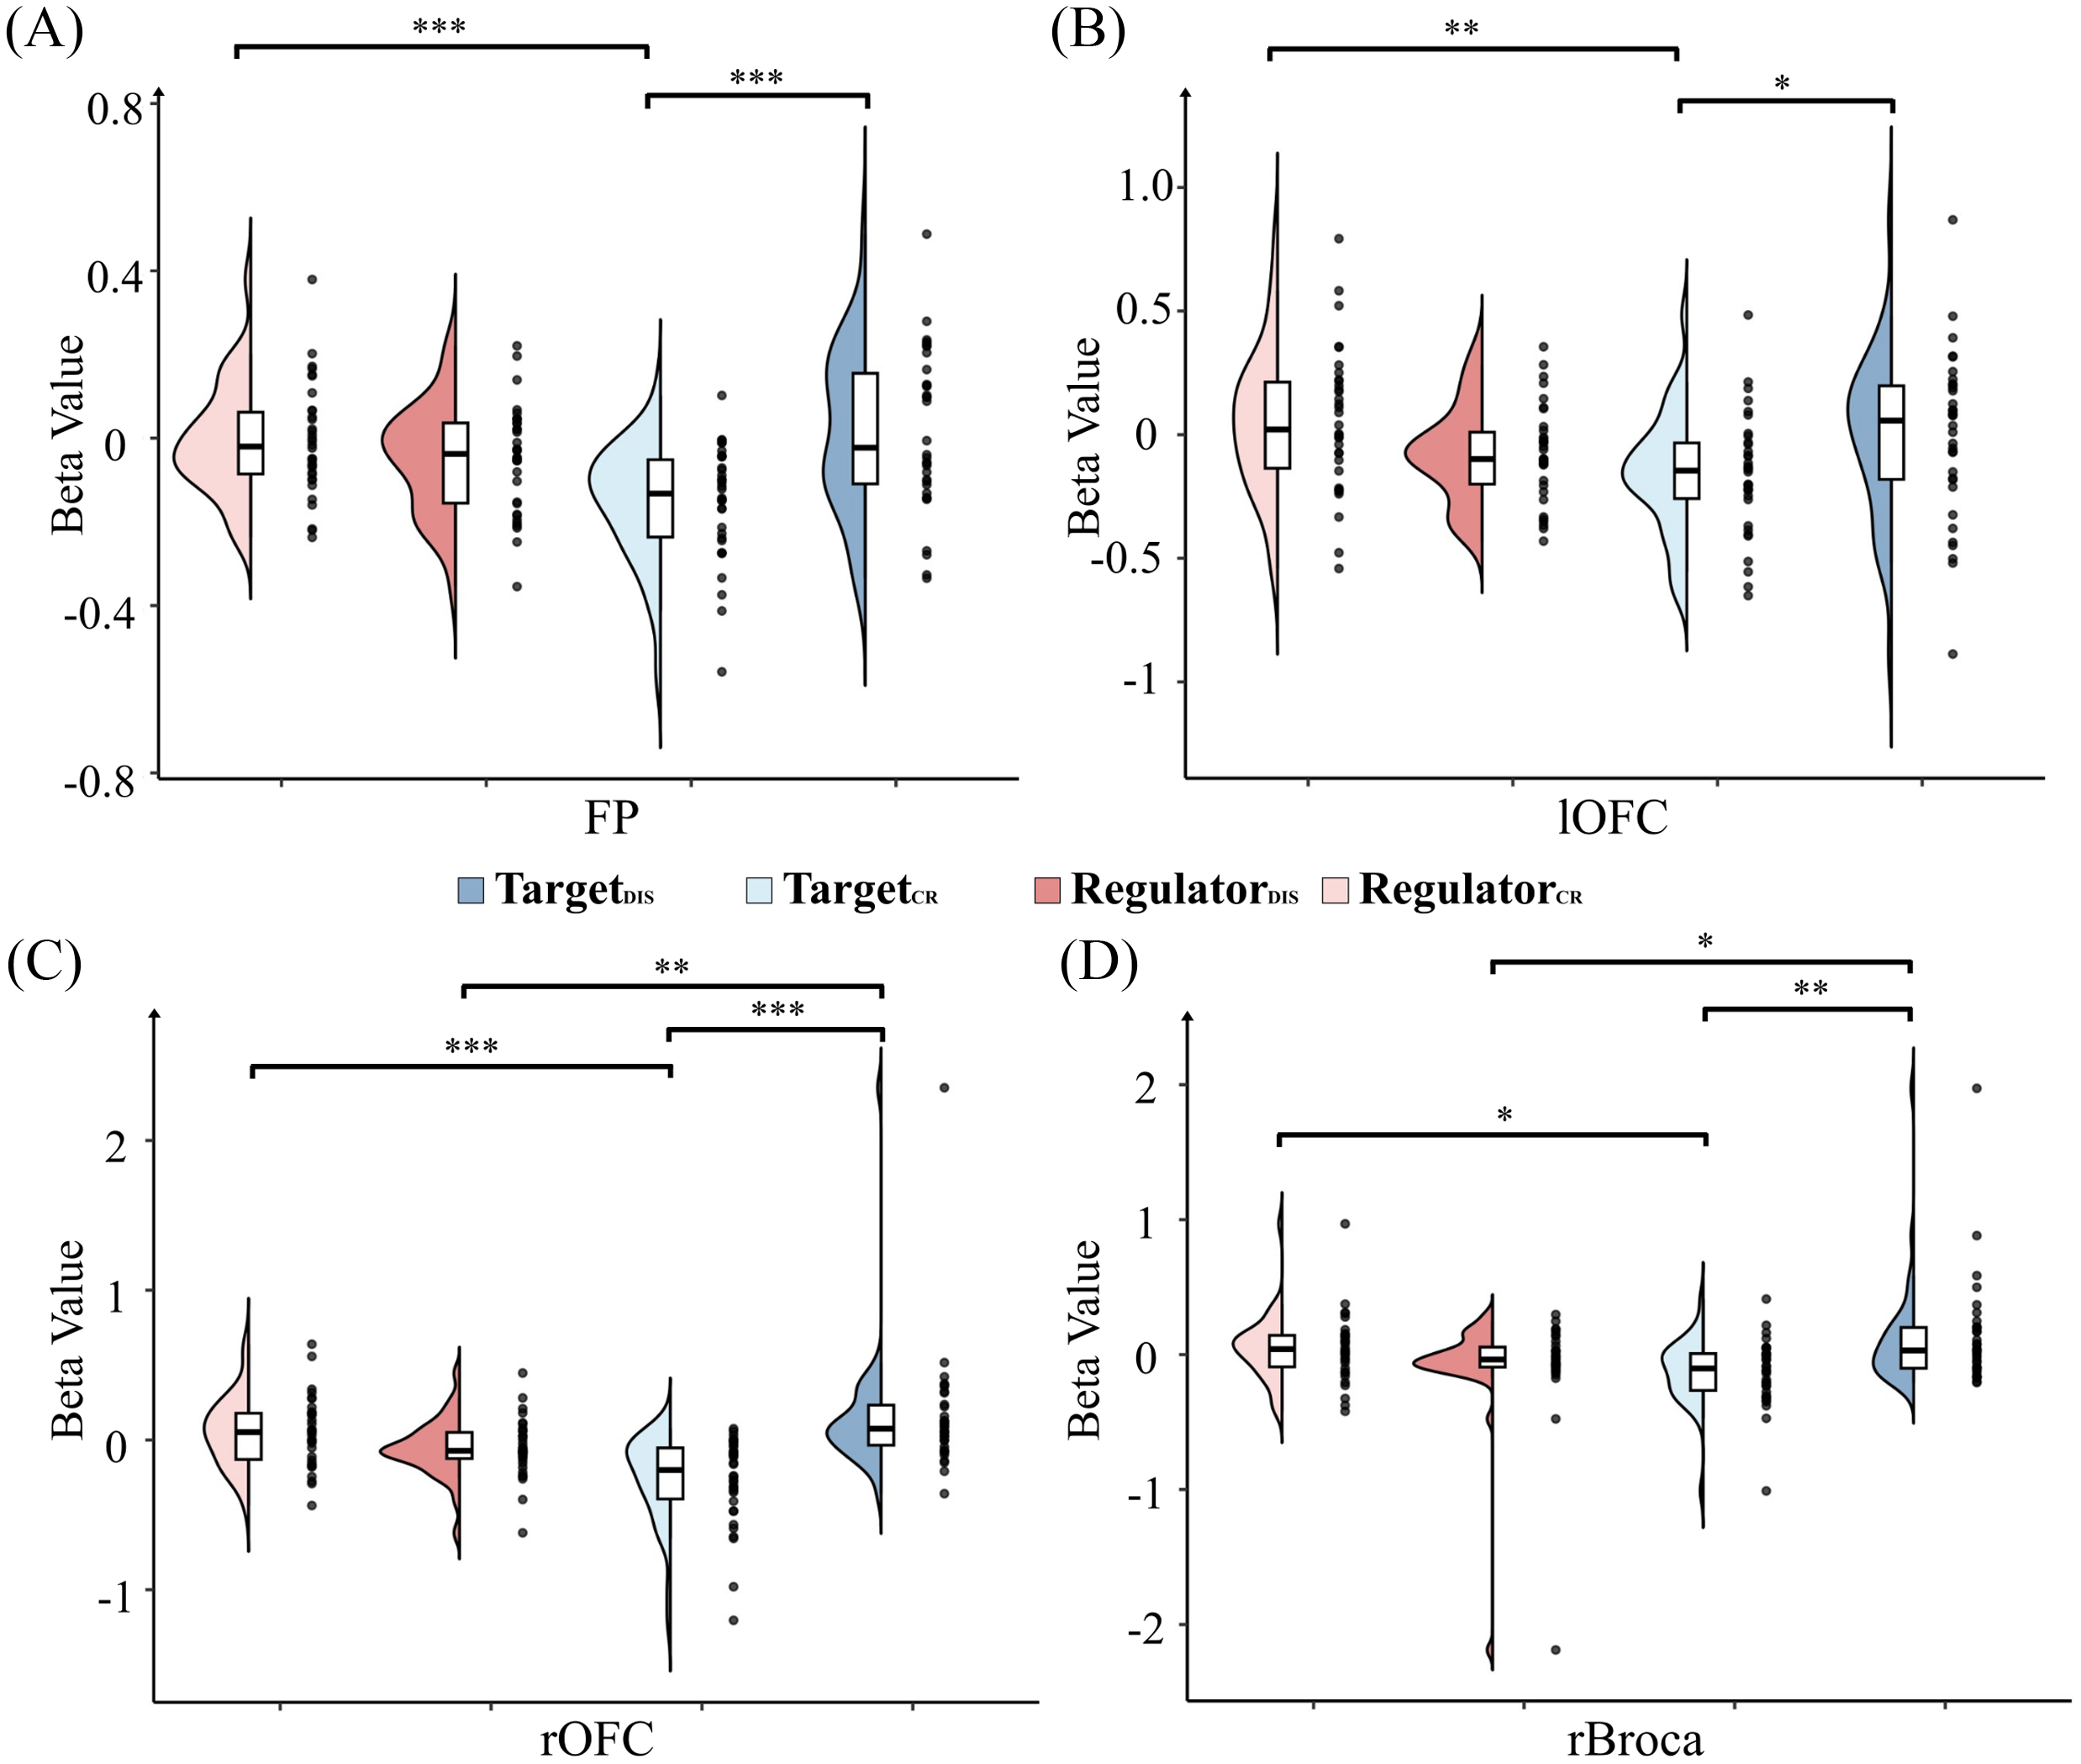 Opens in a new tab.
Interbrain patterns distinguished strategy and success
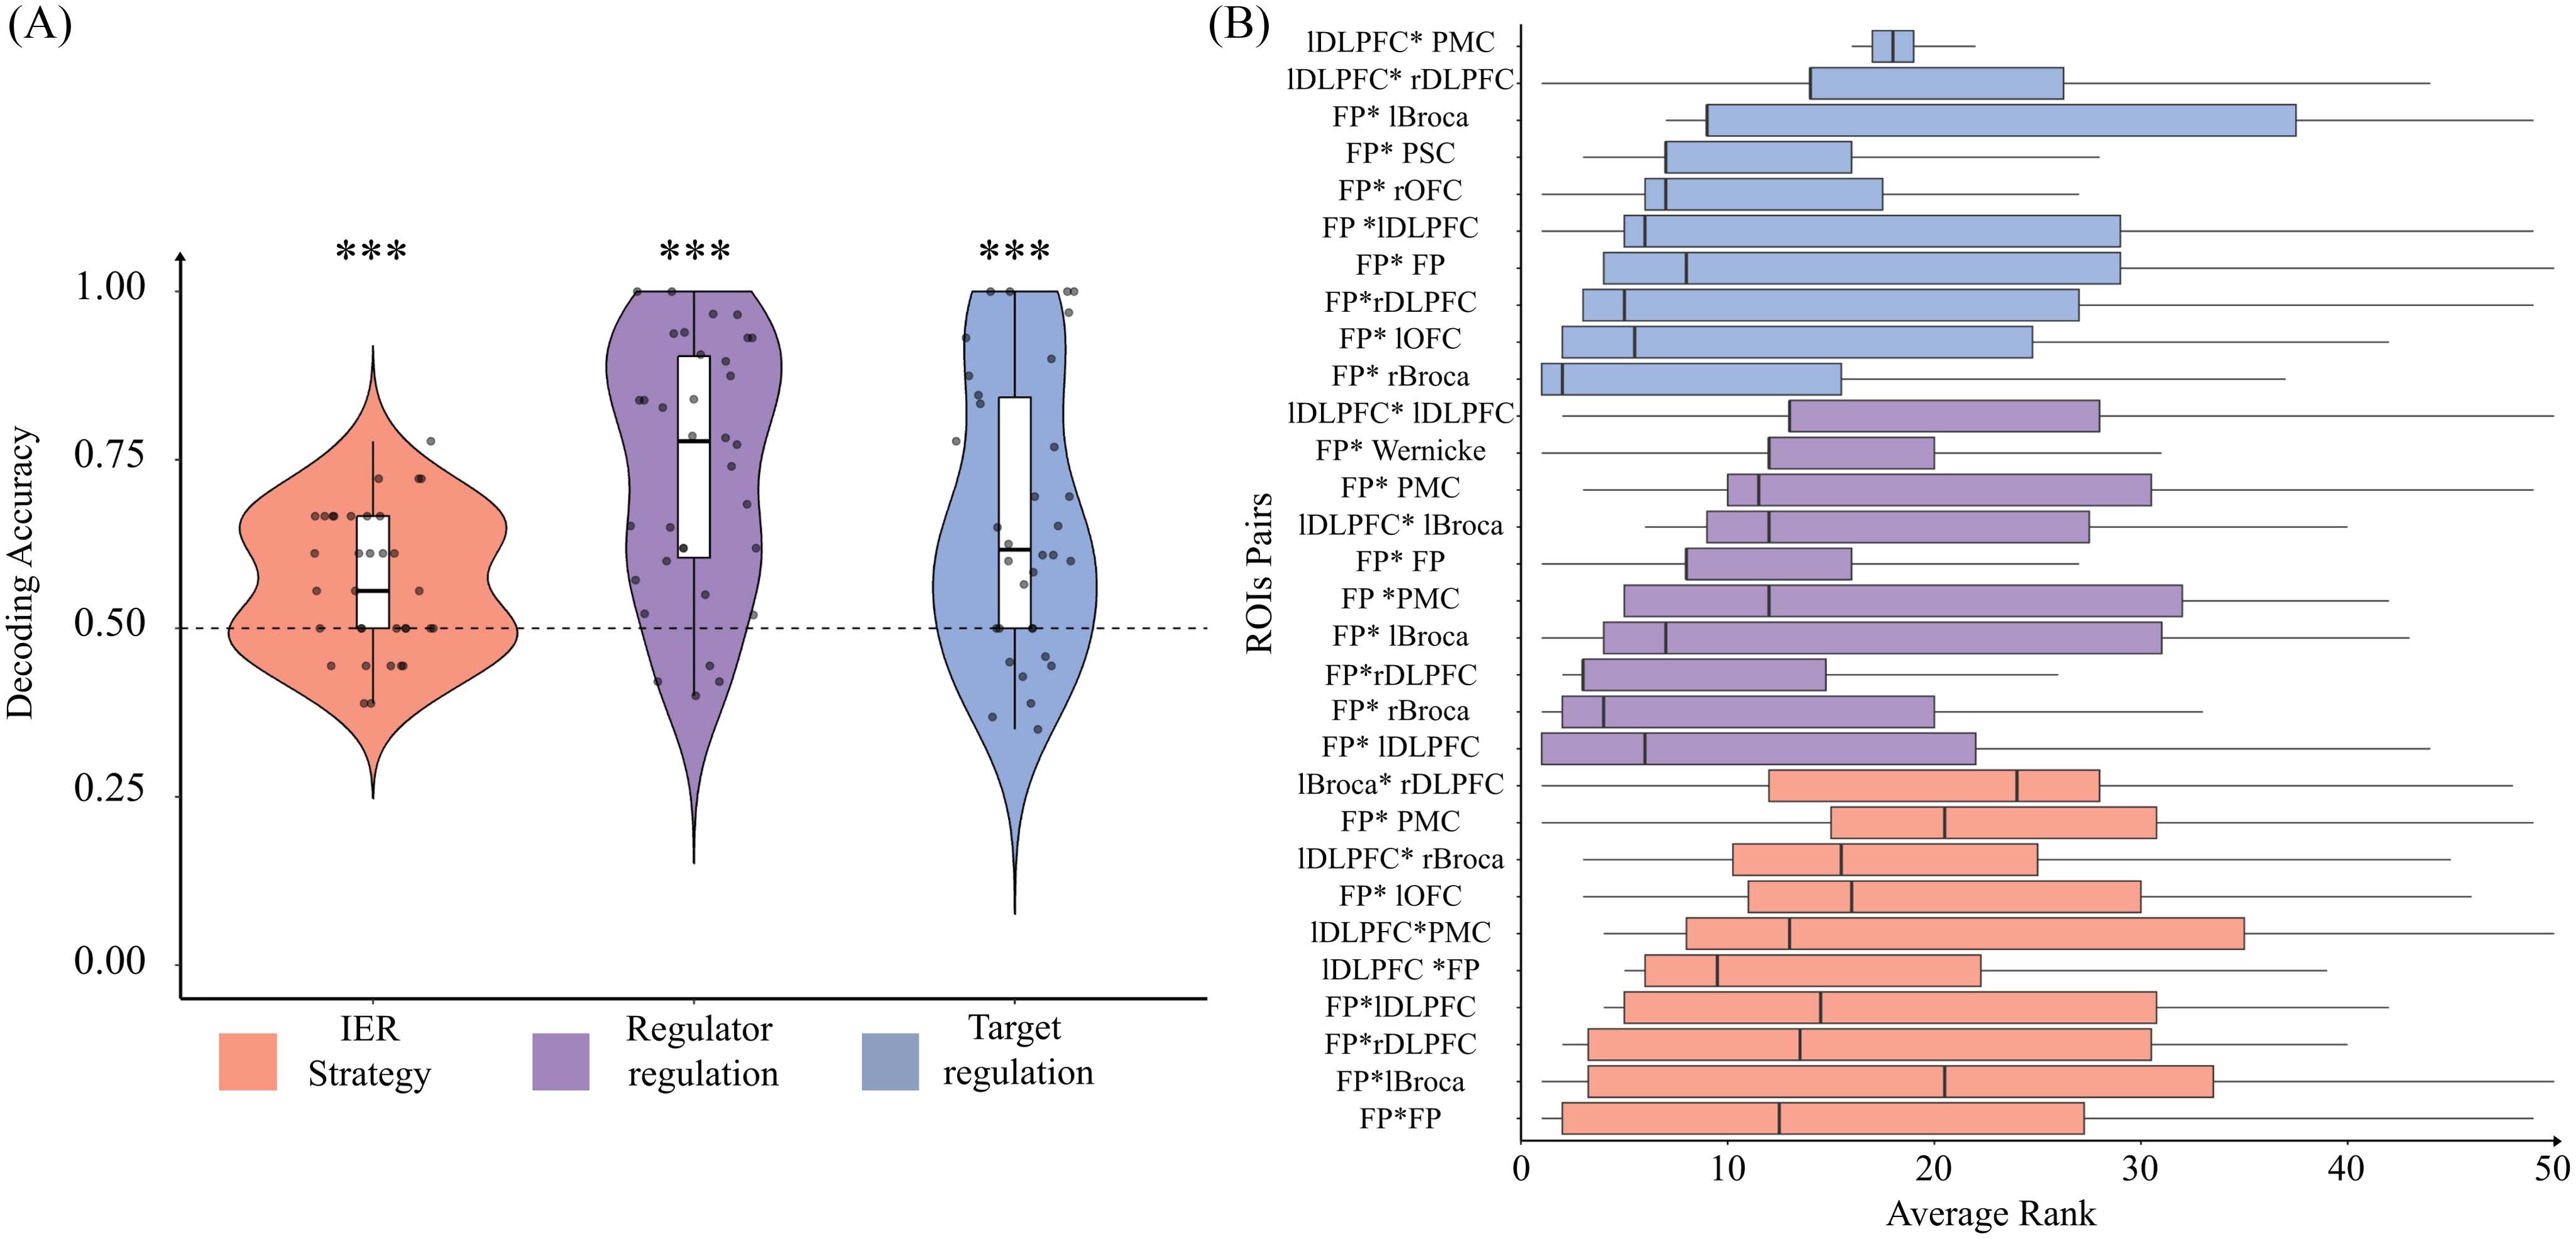
Correlations between the two participants’ regional time courses formed a 10 × 10 interbrain-synchronization matrix for each trial. In five-fold within-participant cross-validation, classifiers distinguished the strategy, regulator success and target success above 50% chance (all FDR-corrected p < .001). Success meant a more positive valence rating on the second viewing.
Feature-importance rankings differed across region pairs for all three classifiers. Connections involving the regulator’s frontal pole appeared repeatedly among the most informative features.
 Opens in a new tab.
Exploratory functional interpretation
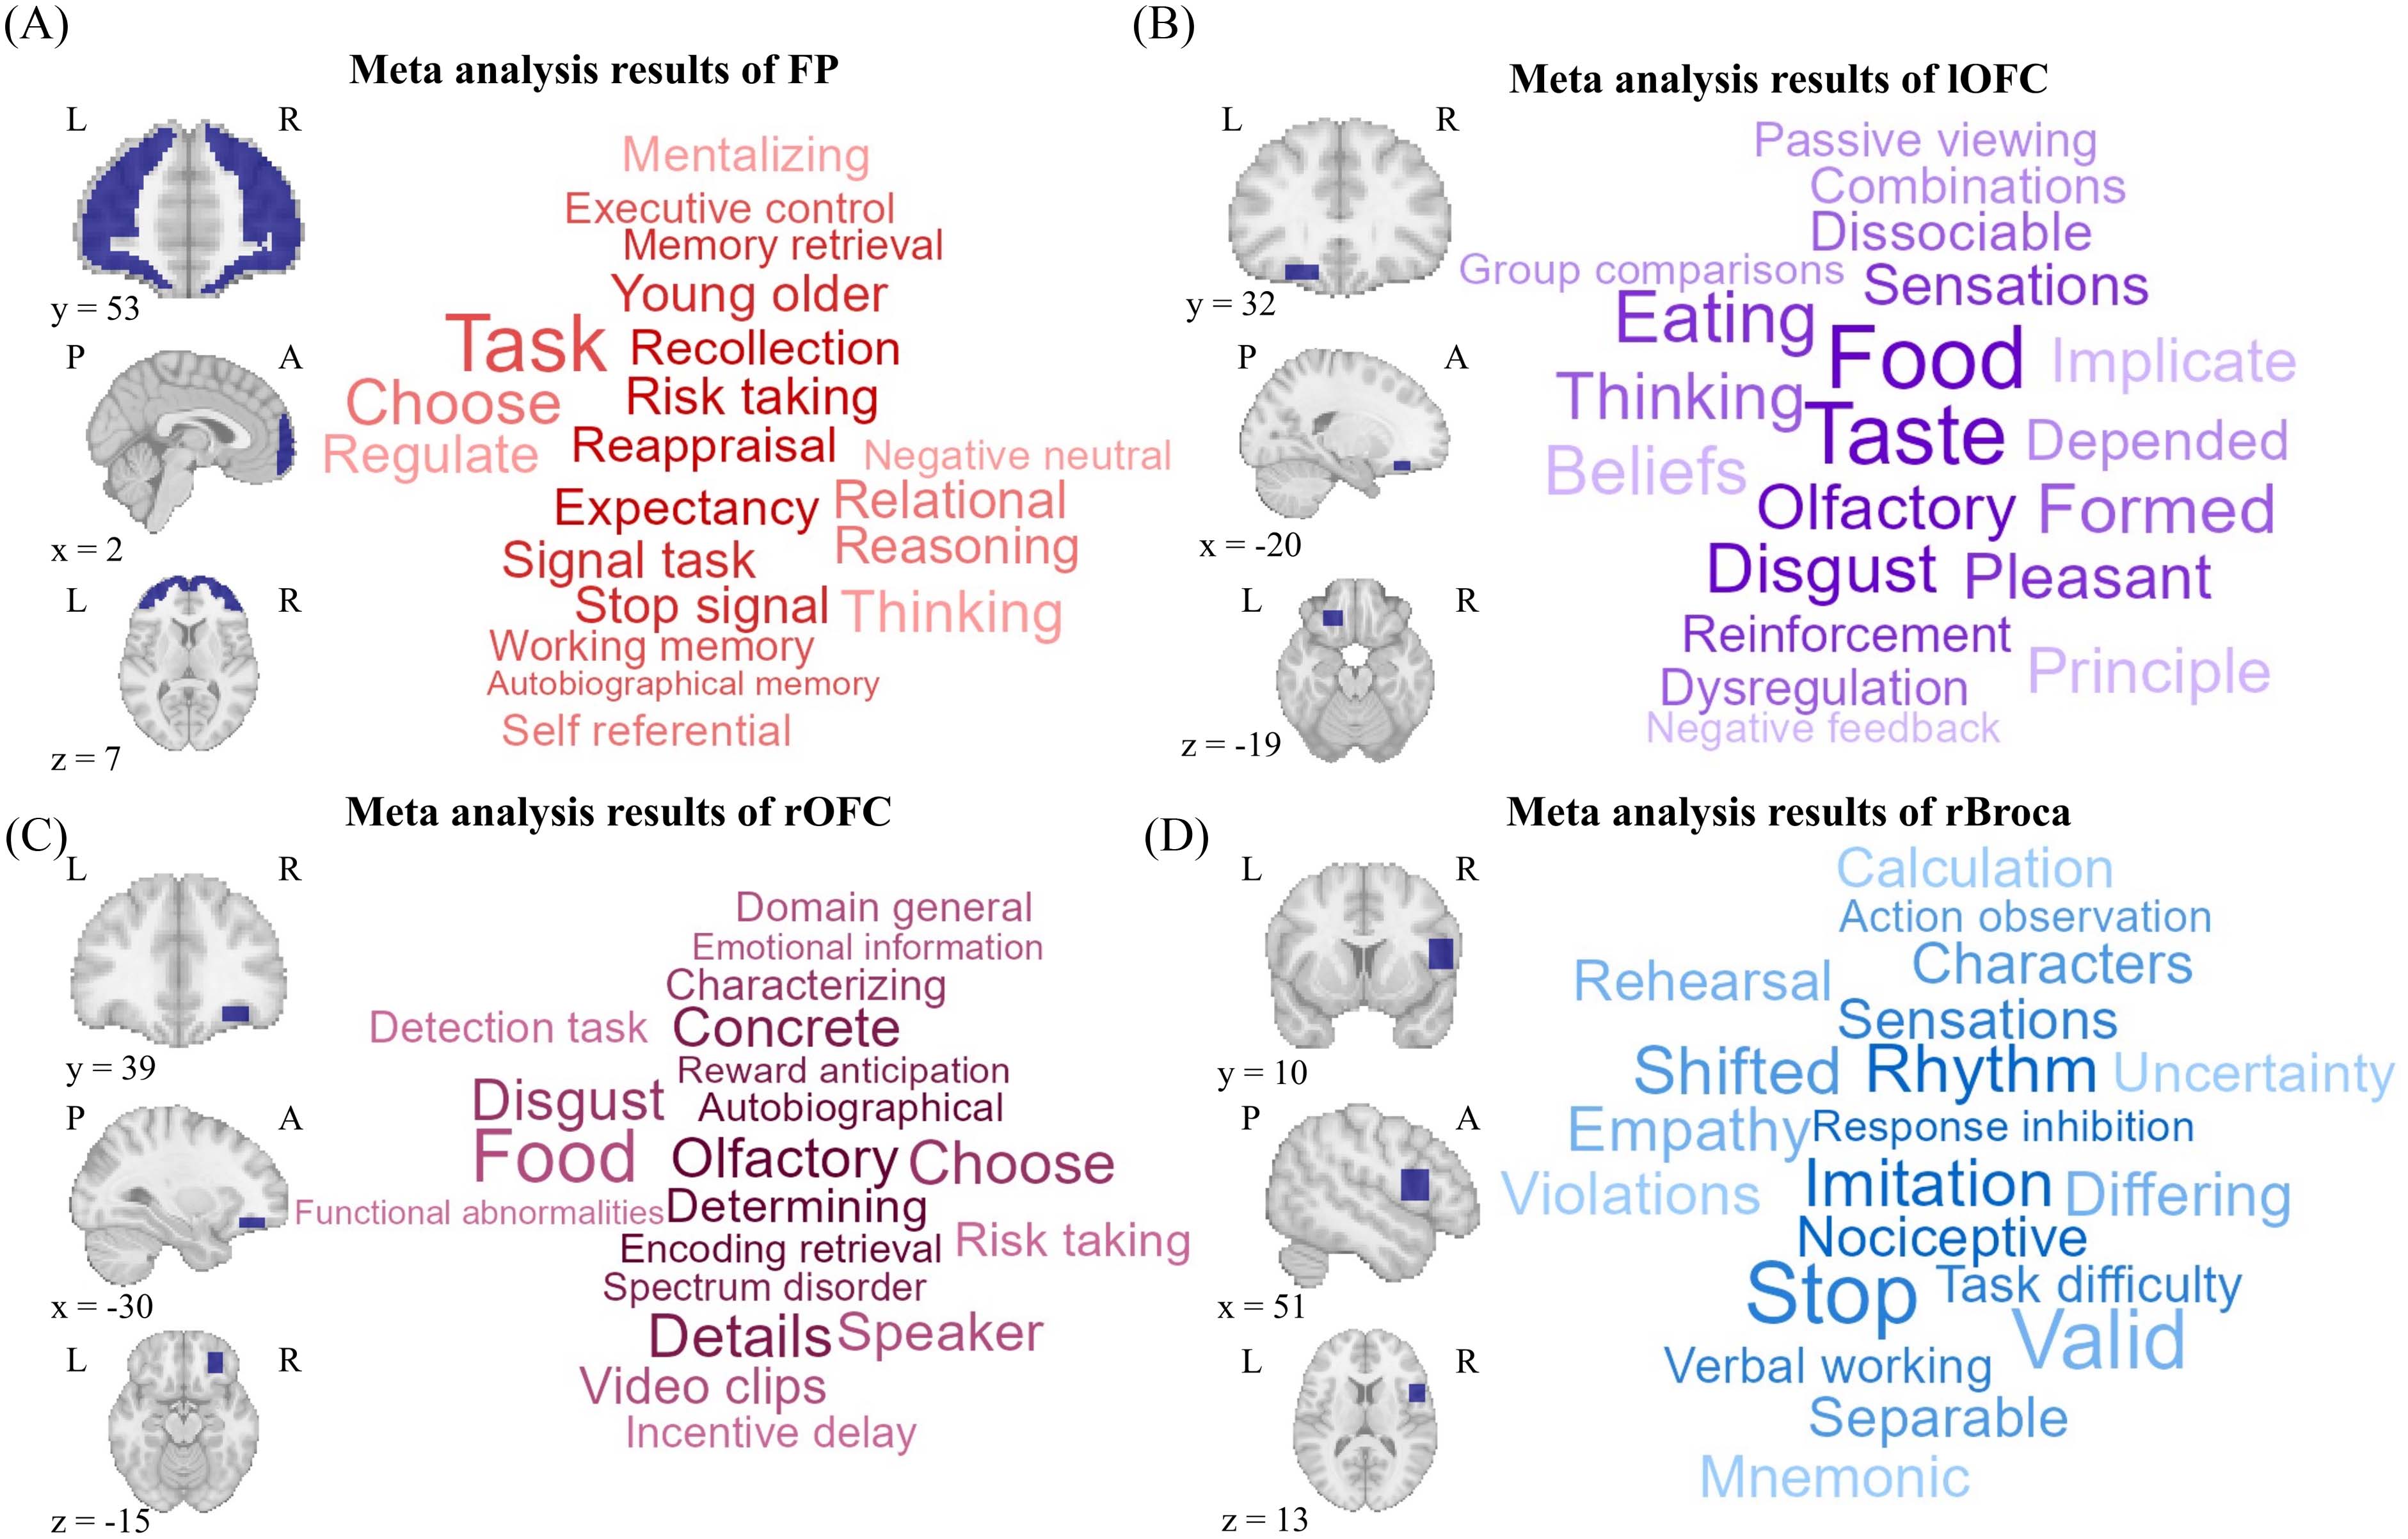
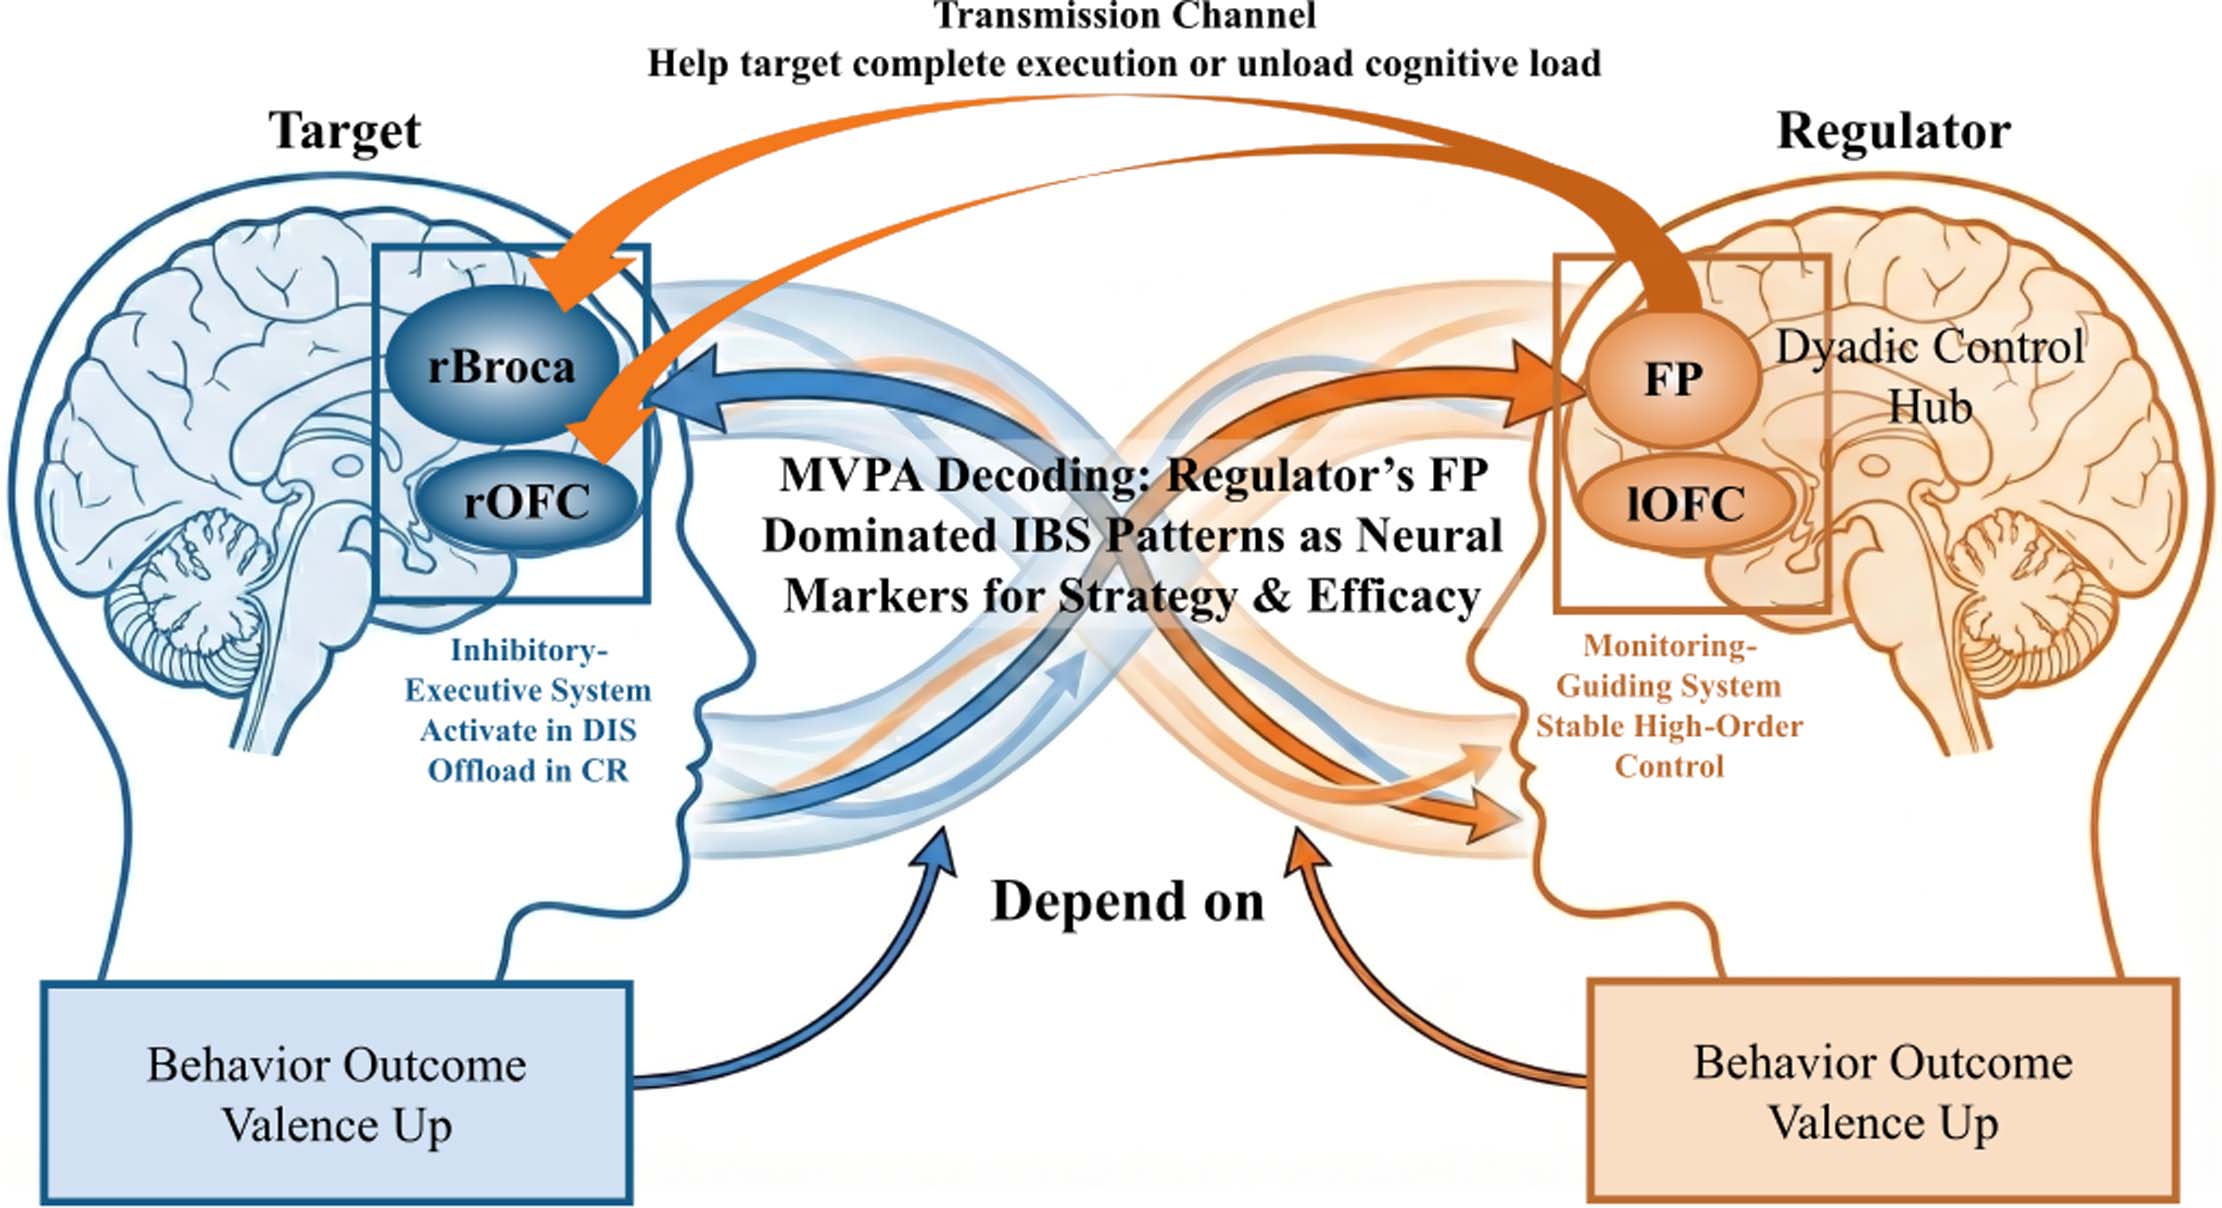
Neurosynth analyses linked the four regions to terms from the neuroimaging literature. These associations informed an interpretation in which regulators support monitoring and guidance, while targets engage different demands when accepting a reinterpretation or doing arithmetic. This functional account remains exploratory.
 Opens in a new tab.
The paper’s proposed theoretical model
 Opens in a new tab.
Reported statistical comparisons
Behavior
Valence main effects: role, F(1, 231) = 69.08, η² = .23; time, F = 70.91, η² = .23; strategy, F = 36.68, η² = .14. The time × strategy interaction was F = 22.40, η² = .09 (all p < .001). Other valence interactions had Fs < 3.43, ps > .065. Arousal had no significant main effects or interactions (Fs < 3.63, ps > .058).
Regulators versus targets: t(231) = 8.31, d = 1.01; post- versus preregulation: t = 8.42, d = 1.02; reappraisal versus distraction after regulation: t = 7.63, d = 1.31 (all p < .001). Before regulation, the strategy comparison was t = .94, p = .350, d = .16.
Activation
Role × strategy interactions, all with F(1, 99): FP, 17.20, p < .001, η² = .15; lOFC, 9.30, p = .003, η² = .09; rOFC, 26.09, p < .001, η² = .21; rBroca, 10.95, p = .001, η² = .10. Strategy main effects were also reported in FP (F = 6.31, p = .014, η² = .06) and rOFC (F = 9.45, p = .003, η² = .09).
- FP: targets DIS > CR, t(99) = 4.70, p < .001, d = 1.14; regulators > targets under CR, t = 4.02, p < .001, d = .98.
- lOFC: targets DIS > CR, t(99) = 2.35, p = .021, d = .57; regulators > targets under CR, t = 3.02, p = .002, d = .78.
- rOFC: targets DIS > CR, t(99) = 5.79, p < .001, d = 1.40; targets > regulators under DIS, t = 2.86, p = .005, d = .69; targets < regulators under CR, t = −4.37, p < .001, d = −1.06.
- rBroca: targets DIS > CR, t(99) = 3.19, p = .002, d = .77; targets > regulators under DIS, t = 2.54, p = .013, d = .61; targets < regulators under CR, t = −2.14, p = .034, d = −.52.
Synchrony-based decoding
One-sample tests against .50 chance, all with t(33): strategy, 3.78, d = 1.31; regulator success, 7.41, d = 2.58; target success, 4.73, d = 1.65 (all FDR-corrected p < .001). Importance rankings differed across region pairs for strategy, regulator success and target success: χ²(99) = 592.68, 754.58 and 785.33, respectively (all p < .001).
Analysis methods and study scope
After quality checks and preprocessing, activation analyses used task-related oxygenated-hemoglobin estimates. Behavioral and activation models included a dyad random intercept. Trial-level Pearson correlations between ten regions per person supplied the interbrain features. Support-vector machines used five-fold within-participant cross-validation, with oversampling to balance classes when needed; permutation importance ranked the features.
The study recruited 68 female university students in 34 dyads. Its sampling and cortical coverage limit generalization, and the meta-analytic functional account remains a candidate explanation for further hypothesis-driven research.